Statistics
Per-Order Summary Cards
Four summary cards sit at the top of the Order Lifecycle field on every order edit page, with a Started/Completed bar underneath:
- Time to Convert - from the first cart activity to order completion
- Checkout Duration - from checkout started to the order being paid
- Cart Items - line items added and removed
- Customer - new or returning, with a link to their previous order count
Any card that hasn't happened yet is simply left out rather than shown as empty. See Timeline View for the full breakdown, including what the Started/Completed bar shows.
Duration Formats
| Range | Format | Example |
|---|---|---|
| Under 1 minute | Seconds |
45s |
| 1 minute - 1 hour | Minutes and seconds |
5m 30s |
| 1 hour - 24 hours | Hours and minutes |
2h 15m |
| Over 24 hours | Hours and minutes |
26h 45m |
Store Dashboard
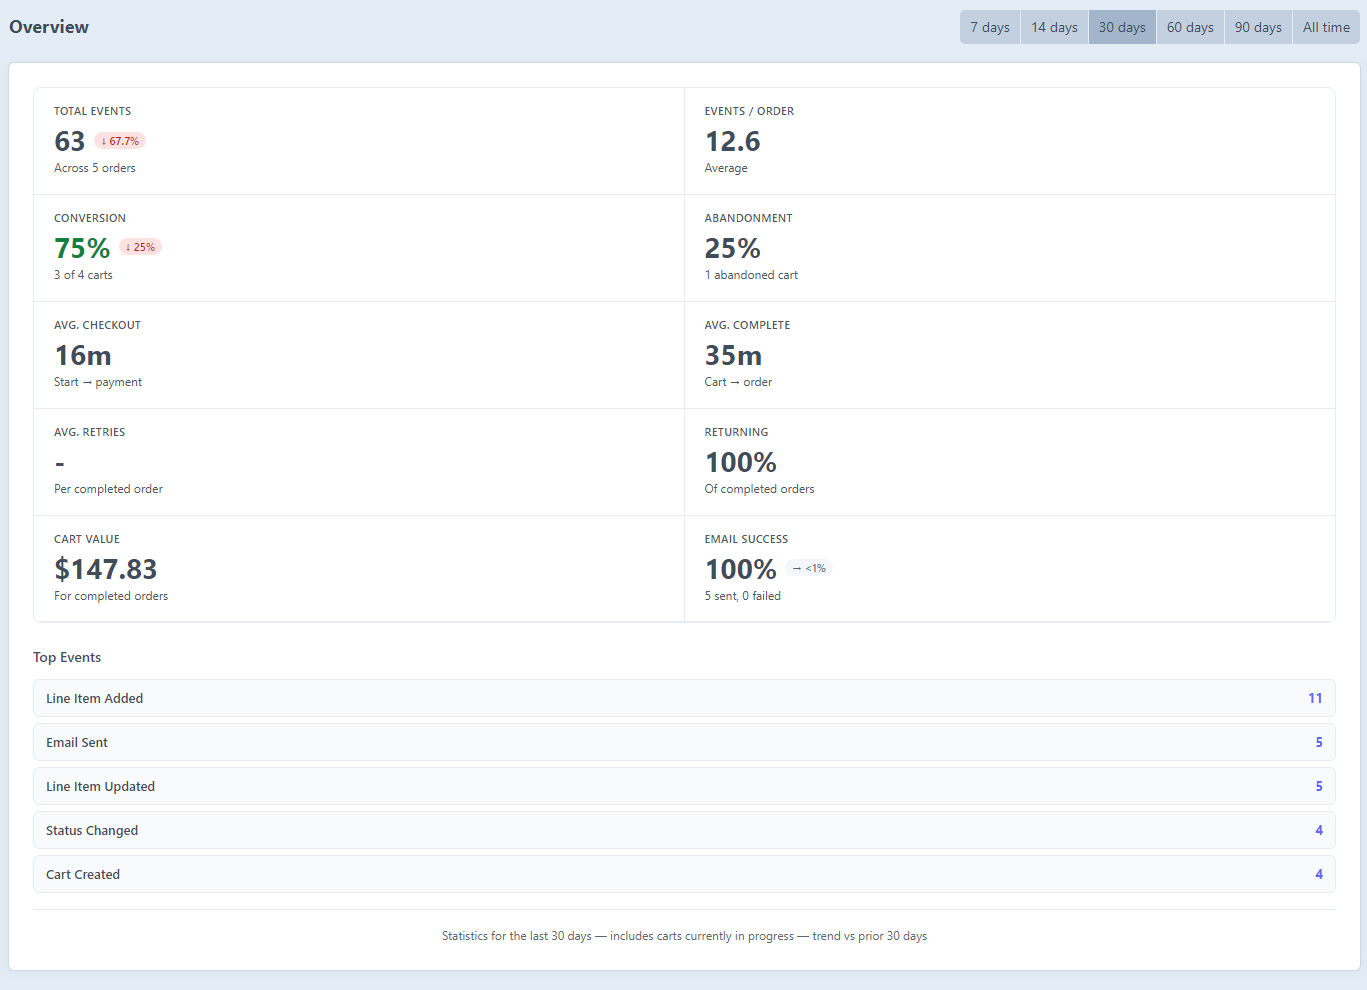
The dedicated Order Lifecycle section in the Craft control panel is where you go for store-wide metrics. Navigate to Order Lifecycle → Overview in the sidebar.
On a multi-store setup, every metric on the Overview page and the dashboard widget is scoped to the store you currently have selected in Commerce, so one store's numbers never mix in with another's.
Time Window
Switch periods using the button group in the top-right corner of the page. Available windows are 7, 14, 30, 60, 90 days, or All time (no date filter).
The All time view includes every log since the plugin was installed. Trend indicators aren't shown for the all-time view, since there's no equivalent prior period to compare against.
Metrics
- Total lifecycle log entries
- Unique orders tracked
- Average logs per order
- Top 5 event types by frequency
- Average time to order completion
- Conversion rate (carts created → orders completed)
- Avg. Checkout Time - time from the
checkoutStartedevent to payment. Shows blank when no checkout-start event was recorded for the orders in the window (e.g. admin- or API-created orders that skip checkout tracking) - Cart abandonment rate - the share of created carts that had at least one item added, then went more than an hour without any activity, without completing
- Avg. Payment Retries - the average number of retries among orders that actually needed them. A value of
0means the order paid on the first try - and, as noted under Event Categories and Icons, that first successful attempt doesn't show up in the timeline - Returning Customers % - the share of customers who had a prior completed order, matched by email address
- Average cart value
- Email success rate
Rounding
All rate and percentage metrics are rounded to 1 decimal place (e.g. 53.5%, 1.1 retries).
Layout and Colour
The stat grid is grouped by what each metric measures, in a fixed order: volume (Total Events, Events/Order), conversion (Conversion, Abandonment), timing (Avg. Checkout, Avg. Complete), then payment retries, returning customers, and the two optional metrics (Avg. Cart Value, Email Success) if there's data for them. Colour is used sparingly: Conversion turns green at 50% or higher, Abandonment turns amber at 30% and red at 50% - everything else stays neutral so those exceptions stand out.
Trend Chips
Each metric card that supports trending shows a small coloured trend chip (a ↑ / ↓ badge) next to the stat number, comparing the selected period to the equivalent prior period:
| Badge | Meaning |
|---|---|
| ↑ 12% | Metric increased by 12% relative to the prior period |
| ↓ 5% | Metric decreased by 5% relative to the prior period |
| → <1% | Change is negligible (under 1%) |
Colour follows whatever direction benefits the store - green for improvements (e.g. conversion up, abandonment down), red for anything getting worse. If the prior period had no data the badge is left off.
Trends are worked out for total events, unique orders, conversion rate, abandonment rate, and email success rate. The period note at the bottom of the page tells you which window is being compared.
Trends are cached alongside the rest of the stats (5-minute TTL), so switching periods updates the comparison right away.
Alert Banners
If any key metric crosses a concerning threshold, an amber or red banner shows up above the stat grid. Alerts fire when:
| Condition | Threshold | Notes |
|---|---|---|
| No orders tracked | 0 unique orders | Only fires for period-based views, not all time |
| High abandonment | > 75% | Requires at least 5 carts in the period |
| Email failures | Success rate < 90% | Requires at least 5 emails sent or failed |
| Payment friction | Avg attempts > 2 | Requires at least 5 completed orders |
Alerts are informational only - nothing happens automatically off the back of them.
Dashboard Widget
The Order Lifecycle Stats dashboard widget is also there if you'd rather have stats on the main Craft dashboard alongside your other widgets. Add it via Dashboard → Add a widget. It shows the same metrics as the Overview page for a configurable time window.
The widget's own title bar shows the order count in scope (e.g. "Last 11 orders") instead of repeating it in the Total Events card underneath.
The widget's settings (gear icon on the widget) also have a Show Top Events switch, so stores that just want the stat grid can turn the Top Events list off.
Accessing Data Programmatically
Use the logger service to pull log arrays for your own custom reporting:
use johnhenry\orderlifecycle\OrderLifecycle;

$logs = OrderLifecycle::getInstance()->getLogger()->getLogsForOrder($order->id);

// Find key timestamps
$cartCreatedAt = null;
$orderCompletedAt = null;

foreach ($logs as $log) {
    if ($log['type'] === 'cartCreated' && $cartCreatedAt === null) {
        $cartCreatedAt = strtotime($log['dateCreated']);
    }
    if ($log['type'] === 'orderCompleted' && $orderCompletedAt === null) {
        $orderCompletedAt = strtotime($log['dateCreated']);
    }
}

if ($cartCreatedAt && $orderCompletedAt) {
    $minutes = ($orderCompletedAt - $cartCreatedAt) / 60;
    echo "Checkout took {$minutes} minutes";
}
getLogsForOrder() returns database rows as plain arrays. The dateCreated field is a datetime string, so use strtotime() to convert it before doing arithmetic on it.
Use Cases
Spotting Checkout Bottlenecks
A long Time to Convert may indicate:
- A complex or confusing checkout flow
- Cart abandonment and return
- Customers comparison-shopping
Monitoring Payment Performance
A long Checkout Duration may indicate:
- Payment gateway latency
- 3D Secure authentication delays
- Failed attempts before a successful payment
Identifying Abandoned Carts
When a cart has a Started timestamp but no Completed one, it's either still active or has been abandoned. The dashboard's abandonment rate counts a cart as abandoned once it's gone more than an hour without any activity, so a cart the customer is still working through isn't held against you.
Caveats
Empty carts, in-progress carts and the abandonment window
Both Conversion Rate and Abandonment Rate only count carts that had at least one item added (or that went on to complete). Empty per-visitor session carts, the ones Commerce opens for anyone who lands on a cart page, are left out of both, so an empty cart that never got an item doesn't drag conversion down or show up as abandoned. Carts created before the plugin was installed are left out of the same way.
Within that, Conversion Rate still counts carts that are in progress in its denominator (noted at the bottom of the Overview page, "includes carts currently in progress"), while Abandonment Rate is more forgiving: a cart only counts as abandoned once it's had no activity for over an hour (measured from when it was last touched), so a cart the customer is still moving through isn't counted either. That keeps the figure closer to reality even on a short 7-day window.
(This relies on line-item logging, which is on by default. With Log Line Item Changes turned off there's nothing to mark an incomplete cart as having had items, so only completed orders are recognised as carts: Conversion reads close to 100% and Abandonment reads 0. Leave it on if you want either figure to mean anything.)
If you need precise conversion figures for a closed time window, use the Export feature to pull raw events into a spreadsheet or BI tool.
Deleted orders
When Craft purges or deletes an order (including Commerce's inactive cart purge), its lifecycle logs are automatically removed so they don't skew the stats. This happens through Craft's element deletion event and is also covered by Craft's garbage collection cycle.
If you've got orphaned logs from orders deleted before this cleanup was in place, remove them with:
php craft order-lifecycle/logs/purge-orphanedLimitations
- Legacy orders: Events are only recorded from when the plugin is installed onward. Orders created before that will have no lifecycle data.
- Manual orders: Admin-created orders may skip the
cartCreatedevent. - API orders: Orders created via API may not trigger all Commerce events, depending on the integration.
Related Documentation
- Timeline View - Per-order event timeline
- Event Tracking - What events are logged
- Configuration - Enabling/disabling event categories
- Export - Exporting lifecycle events to CSV
- Services API - Programmatic access to log data