Dashboard Widgets
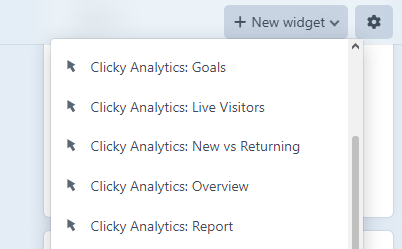
Clicky Analytics adds 21 native widgets to the Craft dashboard. You add them like any other widget: open your Dashboard, click + New widget, and pick one from the Clicky group
Widget settings
Most ranked widgets share a common set of settings:
| Setting | Description |
|---|---|
| Date range | The period this widget reports on. Falls back to the plugin's default date range. |
| Rows | How many ranked rows to show. |
| Consolidate versions | (Browsers and Operating Systems only) Merge version rows into one per family (e.g. one "Google Chrome" row instead of one per version). |
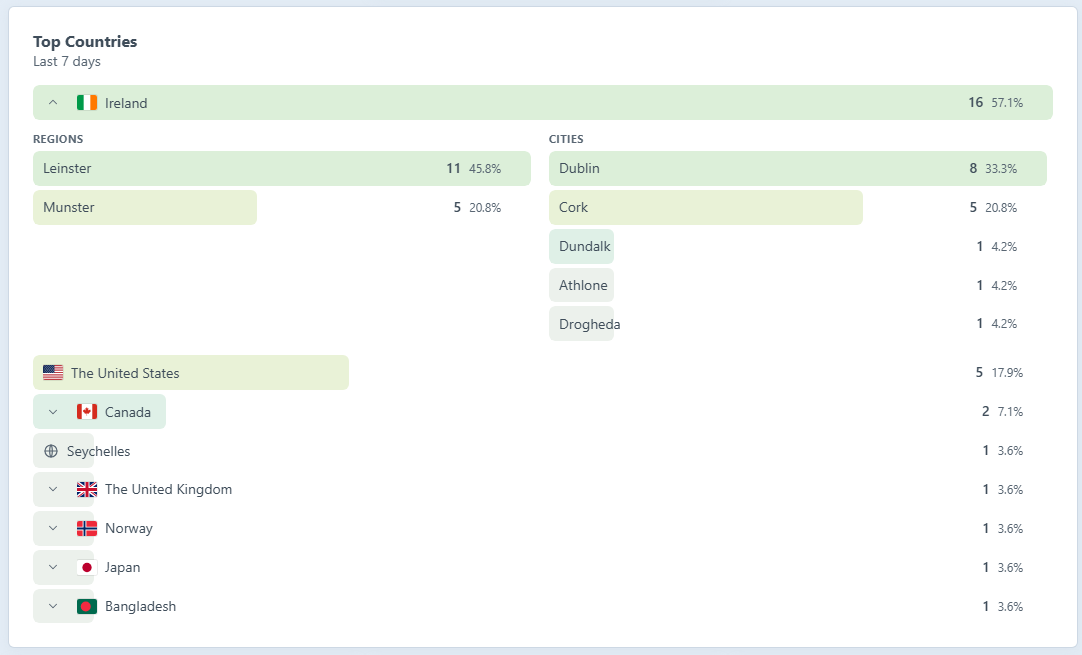
| Drilldown | (Top Countries only) Allow expanding a country to load its cities and regions inline. |
The widgets
Headline & visitors
| Widget | Shows |
|---|---|
| Overview | Visitors, actions, bounce rate and average visit time, with period-over-period trends. |
| Live Visitors | A real-time feed of recent individual visits. See Live Visitors. |
| Current Visitors | The number of visitors online right now. |
| New vs Returning | The split between new and returning visitors. |
Content
| Widget | Shows |
|---|---|
| Top Pages | The most-visited pages. |
| Entry Pages | The most common landing pages. |
| Exit Pages | The most common exit pages. |
| Downloads | The most downloaded files. |
| Goals | Goal completions. |
| Campaigns | Tracked campaign performance. |
Acquisition
| Widget | Shows |
|---|---|
| Top Sources | The top traffic sources. |
| Top Referrers | The top referring domains. |
| Search Engines | Searches grouped by engine, with brand logos. |
Audience
| Widget | Shows |
|---|---|
| Top Countries | Visitors by country, with flags and an optional cities/regions drilldown. |
| Cities | Visitors by city. |
| Regions | Visitors by region. |
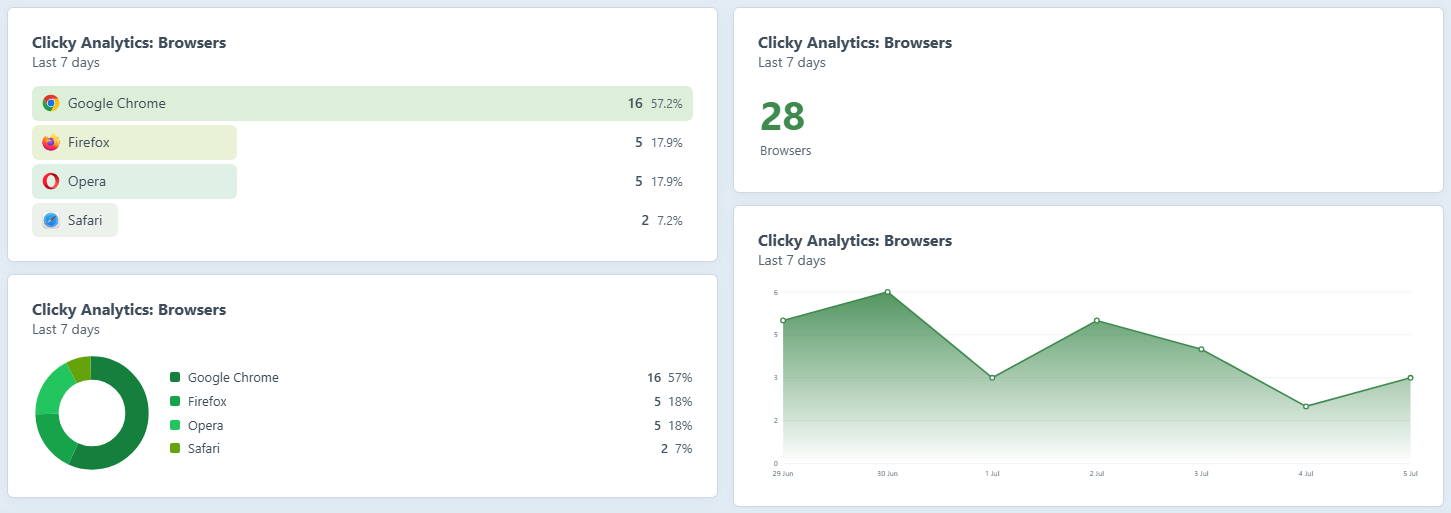
| Top Browsers | Web browsers, with logos and optional version consolidation. |
| Operating Systems | Operating systems, with logos and optional version consolidation. |
| Devices | Hardware device types (phone / tablet / desktop). |
| Screen Resolutions | Visitor screen resolutions. |
Configurable
The Report widget lets you pick any single Clicky metric and choose how to draw it: Counter, Line, Bar or Pie. Handy for building your own dashboard tiles beyond the presets above.
Open in Clicky
Every ranked row deep-links to the matching report in Clicky, so you can jump straight from a dashboard tile to the full report whenever you need more detail.